

TrendCycle Strategy Performance Summary
Welcome to the official performance breakdown of the TrendCycle trading strategy.
Understand the methodology
Understand the risk
New Performance Link
Strategy Structure: Long-Only and Cash-Centered
The TrendCycle portfolio is a long-only stock portfolio, meaning we take positions exclusively on the long side of the market. We do not short stocks or trade leveraged instruments. At any given time, the portfolio is either invested in high-conviction long positions or sitting in cash.
This approach reflects a risk-conscious strategy focused on capturing upside in favorable conditions, while preserving capital during uncertain or bearish periods. The result is a system that emphasizes growth through trend participation — and safety through disciplined capital management.
Overall Stats
Total Trades: 604
Winning Trades: 290
Losing Trades: 312
Win Rate (%): 48.01%
Average Winner % Gain: 32.03%
Average Loser % Loss: -9.41%
9-1-23 to 9-24-25
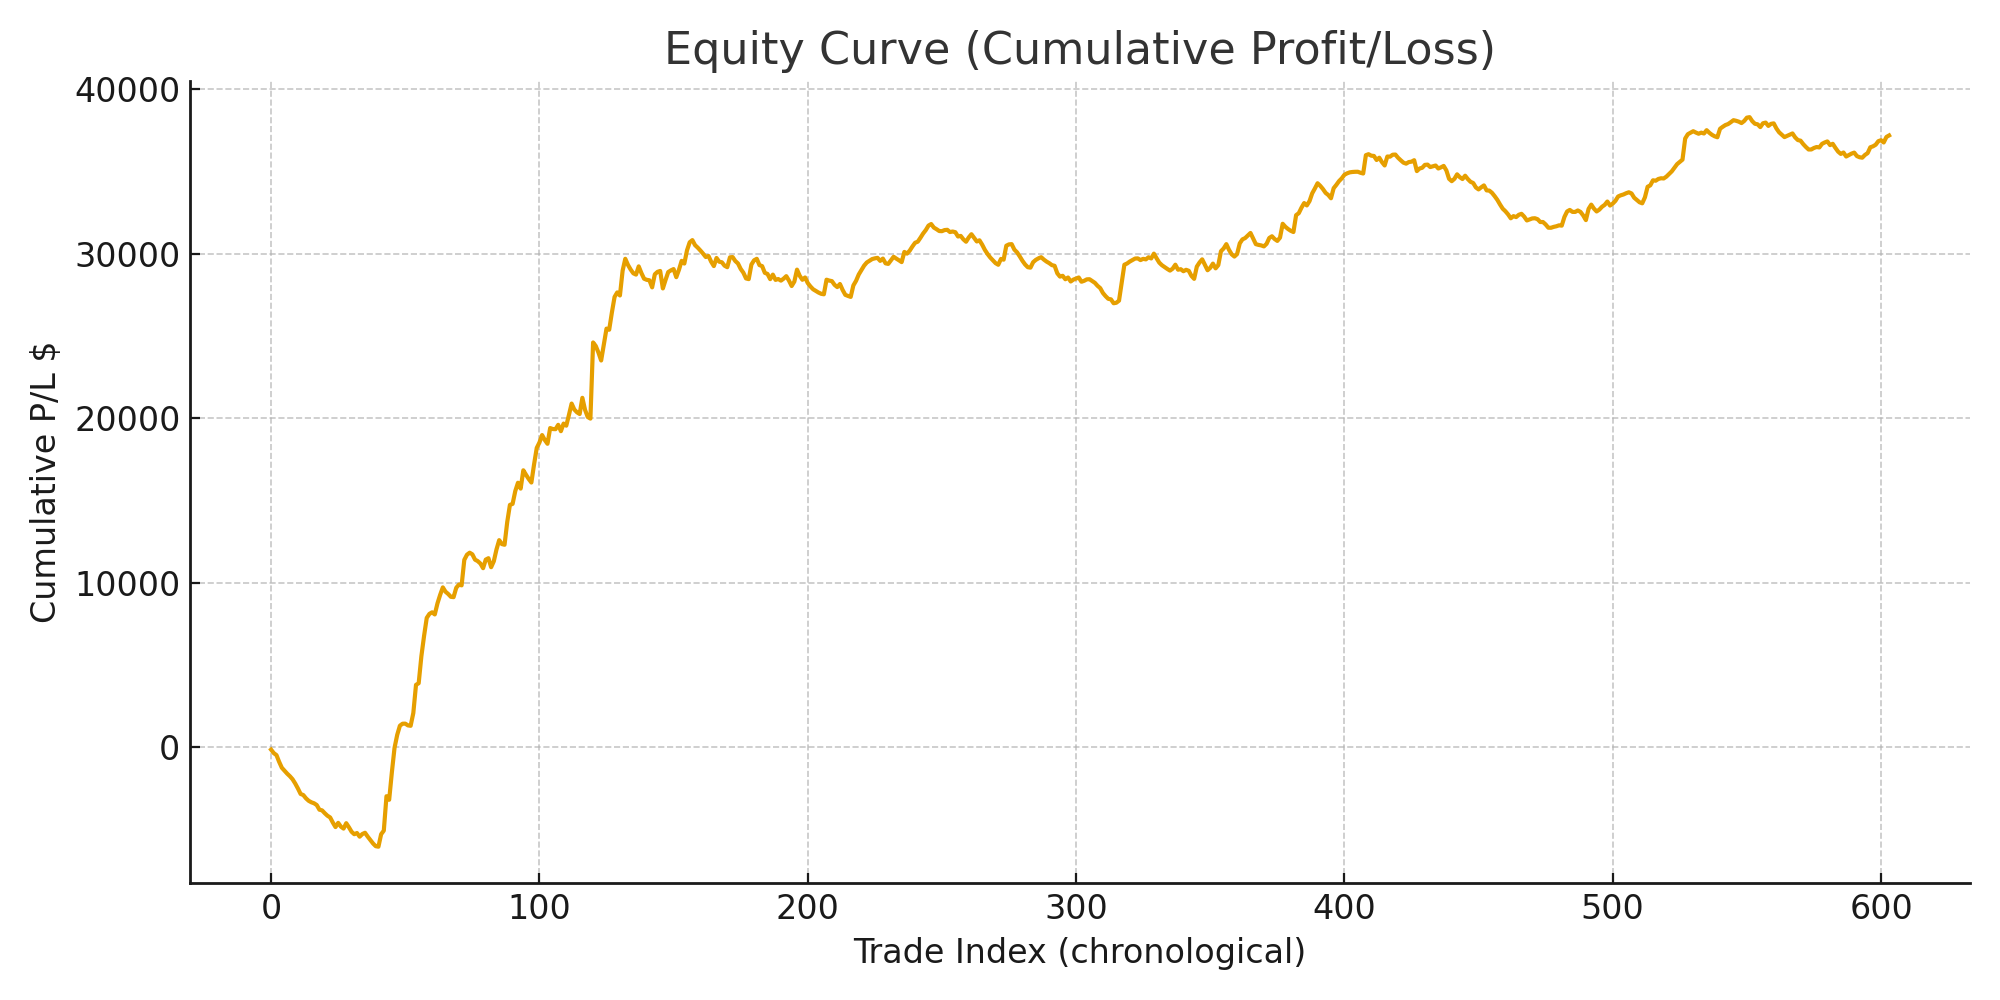
Equity Curve
Below is the equity curve for the TrendCycle strategy, showing the growth of cumulative profit and loss over time.
You can clearly see periods of steady growth, minor pullbacks, and how the system recovers — a hallmark of a strategy that balances risk and reward.
Results
First trade date: 2023-09-18
Last trade date: 2025-09-23
Period: 736 days (≈ 2.02 years)
Starting equity: $99,839.00
Ending equity: $137,191.11
Total return: 37.19% ($37,191.11)
CAGR: 16.99% per year (calculated over 2.02 years)
Maximum drawdown: -5.91% (amount = $5,901.71)
Start Date 9-1-23 to 9-24-25
Understand Your Risk
TrendCycle strategy produced a cumulative return of +37.19%. This growth was achieved through consistent, disciplined execution. The steady upward slope of the equity curve reflects a system built on sustainability for long-term results.
Why These Stats Matter
Most new traders obsess over win rate. But in real trading, it’s not about how often you win — it’s about how much you win when you’re right.
The TrendCycle system follows that principle:
Small, controlled losses when trades don’t work.
Larger, trend-following gains when they do.
Repeatable setups that don’t rely on news, predictions, or emotion.
Conservative Portfolio Management
It’s important to note that this portfolio is managed conservatively by design.
Although the strategy returned ~37.19% (market like returns) on the full $100k account, only ~37% of capital was invested on average — meaning much of the performance came from a smaller pool of deployed capital, which makes the strategy efficient on a dollars-invested basis.
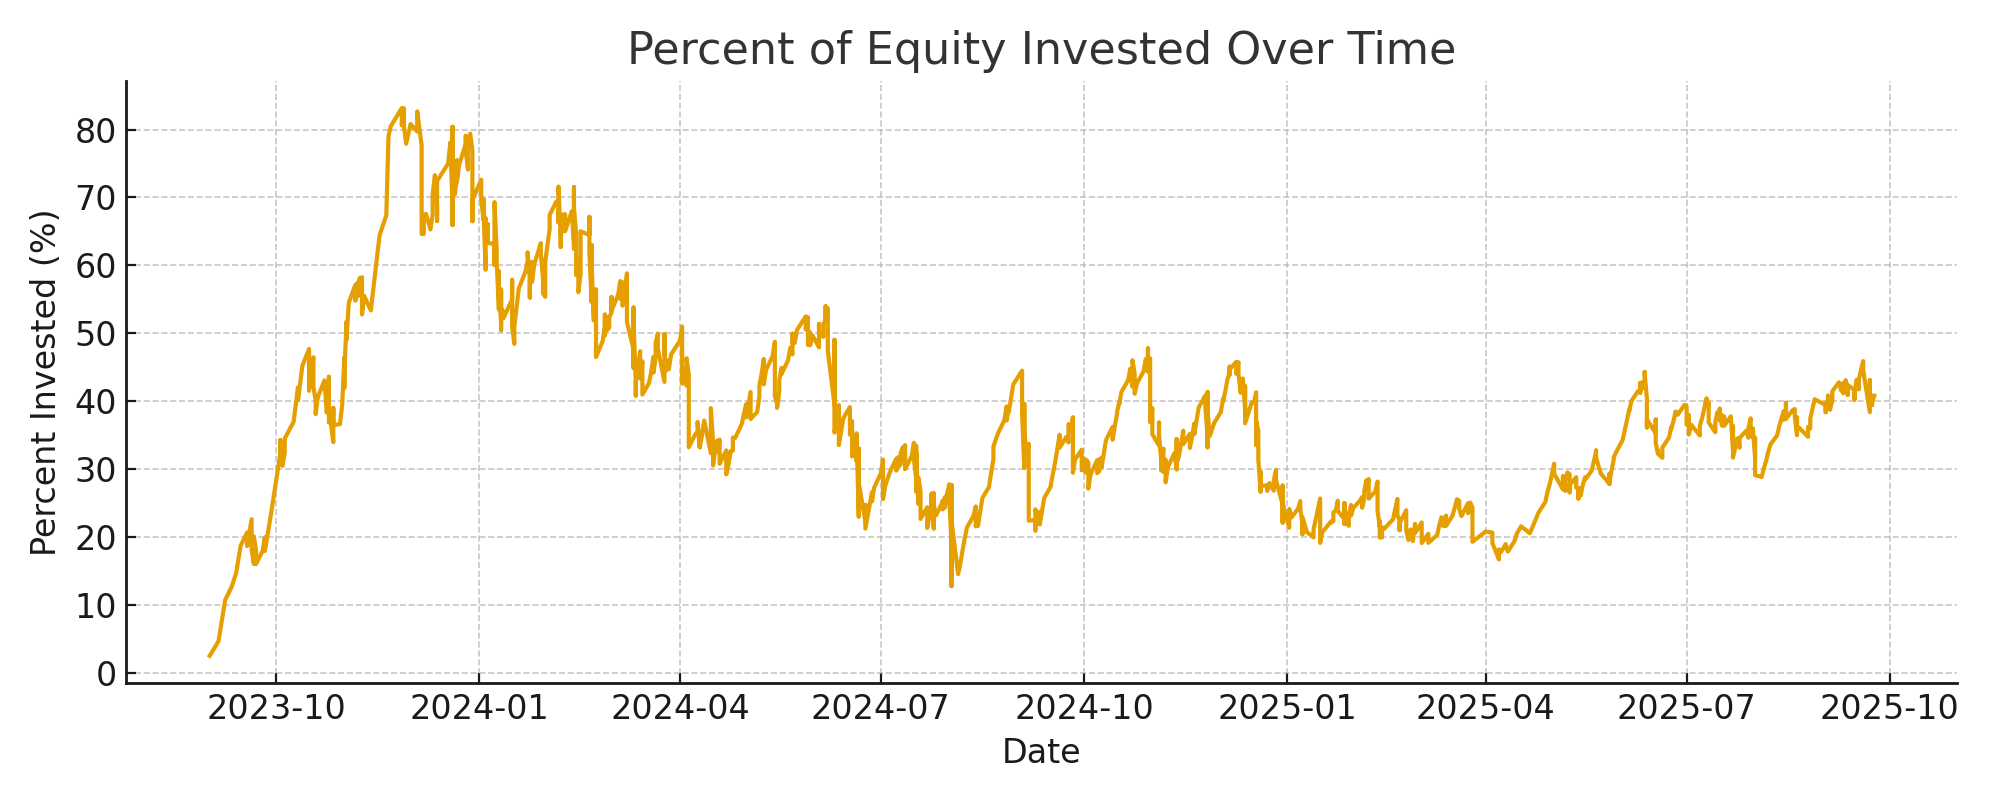
Each position used a capital allocation of just 2% to 2.5%, a level that's considered highly conservative in active trading. This limits downside exposure on any single trade and helps protect capital during choppy or sideways markets.
Can traders take more risk?
Absolutely. If you're comfortable increasing allocation size — say, to 5% or 10% per position — the system scales accordingly. But our baseline approach prioritizes capital preservation first, then growth through consistency.
This conservative structure is what makes the TrendCycle system ideal for traders looking for sustainability, not just short-term excitement.
Drawdown Profile: Stable. Controlled. Professional.
One of the most important measures of a trading system’s reliability is how it performs during pullbacks — and that’s where the TrendCycle strategy really stands out.
Based on a starting capital of $100,000, the drawdowns during this period remained remarkably shallow:
Average Drawdown: -1.31%
Maximum Drawdown: -5.91%
Drawdown Range: Just 5.91% from peak to trough
🔒 This reflects a very stable and low-volatility equity curve, which is the direct result of the strategy’s conservative capital allocation and strict risk management rules. It avoids large portfolio swings, giving traders confidence and peace of mind — even during inevitable periods of chop or consolidation.
If you're looking for a system that emphasizes capital preservation as much as performance, this approach delivers.
What Is Drawdown?
Drawdown is a key risk metric that shows how much a portfolio declines from its highest value before recovering. It represents the temporary loss an investor experiences during a downturn — and helps measure how volatile or stable a trading strategy really is.
For example, if your account peaks at $100,000 and later drops to $94,000, the drawdown is:
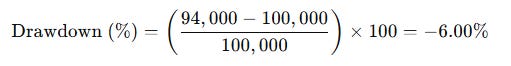
This tells you the portfolio lost 6% of its value during that period before recovering.
Monitoring drawdowns is crucial for understanding emotional risk — how much pressure a trader might feel during declines — and for evaluating how conservatively or aggressively a strategy manages capital.
Full Trade Logs
For full transparency, you can view or download the closed out trades here:
If you’re tired of second-guessing trades, chasing alerts, or reacting to noise, the TrendCycle strategy offers a smarter way forward. Built for clarity, consistency, and confidence, this approach helps you stay in control with simple, repeatable rules and a focus on high-quality setups. Everything you need to grow as a disciplined, independent trader and investor. Join as a paid member today.